

The house of cards that is the greenhouse warming theory continues to collapse. Last week it was the CERN findings relative to cosmic rays and low level clouds, today it is satellite findings that suggest IPCC models get the energy balance VERY wrong.
By Dr. Roy Spencer, Dr. Phllip Gentry, UAH
HUNTSVILLE, Ala. (July 26, 2011)—Data from NASA’s Terra satellite shows that when the climate warms, Earth’s atmosphere is apparently more efficient at releasing energy to space than models used to forecast climate change have been programmed to “believe.”
The result is climate forecasts that are warming substantially faster than the atmosphere, says Dr. Roy Spencer, a principal research scientist in the
Earth System Science Center at The University of Alabama in Huntsville.
The previously unexplained differences between model-based forecasts of rapid global warming and meteorological data showing a slower rate of
warming have been the source of often contentious debate and controversy for more than two decades.
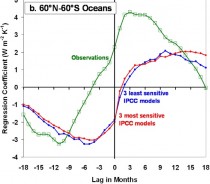
In research published this week in the journal ”Remote Sensing”, Spencer and UAHuntsville’s Dr. Danny Braswell compared what a half dozen climate models say the atmosphere should do to satellite data showing what the atmosphere actually did during the 18 months before and after warming events between 2000 and 2011.
“The satellite observations suggest there is much more energy lost to space during and after warming than the climate models show,” Spencer said. “There is a huge discrepancy between the data and the forecasts that is especially big over the oceans.”
Not only does the atmosphere release more energy than previously thought, it starts releasing it earlier in a warming cycle. The models forecast that the
climate should continue to absorb solar energy until a warming event peaks. Instead, the satellite data shows the climate system starting to shed energy
more than three months before the typical warming event reaches its peak. “At the peak, satellites show energy being lost while climate models show
energy still being gained,” Spencer said.
This is the first time scientists have looked at radiative balances during the months before and after these transient temperature peaks.
Applied to long-term climate change, the research might indicate that the climate is less sensitive to warming due to increased carbon dioxide
concentrations in the atmosphere than climate modelers have theorized. A major underpinning of global warming theory is that the slight warming
caused by enhanced greenhouse gases should change cloud cover in ways that cause additional warming, which would be a positive feedback cycle.
Instead, the natural ebb and flow of clouds, solar radiation, heat rising from the oceans and a myriad of other factors added to the different time
lags in which they impact the atmosphere might make it impossible to isolate or accurately identify which piece of Earth’s changing climate is feedback
from manmade greenhouse gases. “There are simply too many variables to reliably gauge the right number for that,” Spencer said. “The main finding from this research is that there is no solution to the problem of measuring atmospheric feedback, due mostly to our inability to distinguish between radiative forcing and radiative feedback in our observations.”
For this experiment, the UAHuntsville team used surface temperature data gathered by the Hadley Climate Research Unit in Great Britain. The radiant
energy data was collected by the Clouds and Earth’s Radiant Energy System (CERES) instruments aboard NASA’s Terra satellite.
The six climate models were chosen from those used by the U.N.’s Intergovernmental Panel on Climate Change. The UAHuntsville team used the
three models programmed using the greatest sensitivity to radiative forcing and the three that programmed in the least sensitivity.
See paper here.
By Dr. Tim Ball, Climate Change Dispatch
The temperature graph dubbed the “hockey stick” (HS) was designed to rewrite history by eliminating the Medieval Warm Period (MWP) because it contradicted the Intergovernmental Panel on Climate Change (IPCC) claim the 20th century was the warmest ever. As Lord Monckton explains, “Dr. McIntyre’s account of the systematically dishonest manner in which the “hockey-stick” graph falsely showing that today’s temperatures are warmer than those that prevailed during the medieval climate optimum was fabricated in 1998/9, adopted as the poster-child of climate panic by the IPCC in its 2001 climate assessment, and then retained in its 2007 assessment report despite having been demolished in the scientific literature.” It did more damage than generally discussed.

A major problem and serious limitation in climate science is the amount and nature of data. Temperature measures come from a variety of sources so creating meaningful continuous records is very difficult. The Hockey Stick fiasco underlined this, but what they did possibly deters many from taking up the problem. In his autobiography Hubert Lamb said he founded the Climatic Research Unit (CRU) in 1972 because, “it was clear that the first and greatest need was to establish the facts of the past record of the natural climate in times before any side effects of human activities could well be important.”” He was right and nobody did more to reconstruct the past. Ironically, his graph with the MWP in the first two IPCC Reports triggered the HS. Due to misplaced funding for data collection and corrupted research, it is worse now.
Temperature data comes in two forms; direct instrumental measurement or a secondary indicator known as a proxy temperature. Proxies are used by paleoclimatologists and include ice cores, tree rings, lake sediments (varves), pollen counts, or anything that results from temperature or precipitation changes.
Another challenge in obtaining measures of temperature is the problem of reconstructing a continuous temperature record. Traditionally, climate has recognized three periods.
Most recent is the instrumental (secular) period that some claim covers 150 years, but in reality is inadequate for the entire period. Temperatures are measured by half a degree Celsius so any other temperature number is a statistic. Accuracy is also a problem. CRU Director Phil Jones claimed an increase of 0.6C in the last 130 years, but with an error range of plus/minus 0.2C.
Historic records cover approximately 3000 years. They include everything from information on the walls of Pharaohs tombs to crop reports such as the remarkable wine harvest record used in Times of Feast, Times of Famine by Emmanuel Le Roy Ladurie or the Hudson’s Bay Company (HBC) records I used to reconstruct almost 300 years. At best accuracy of 1C is possible.
This is the largest sector covering most of the Earth’s history and includes proxy indicators from biologic and geologic sources. Levels of accuracy decrease and the error factor increases going back in time. Even if you get a reasonable temperature estimate you must have an accurate date. Good materials and skilled hands can yield ages that are certain to within 1 percent, even in rocks only 10,000 years old, in which quantities of 40Ar are vanishingly small. But 1 percent of 1 million years is 10,000 years and we have emerged from an Ice Age in that time. Even radiocarbon dating used for dates over 65,000 years, have a relatively wide error factor.
Some proxies cross these boundaries and are therefore valuable. Tree rings are one of these and provide a transition across all three. Particularly appealing are Bristlecone Pines because the oldest is 4,789, but they were problematic because growth
is primarily controlled by precipitation. The hockey stick gang assumed annual growth rings were due to temperature when most are about precipitation levels. I was involved in early work to make links. Dendroclimatologist Joel Guiot used the HBC temperature record I created for Churchill, Canada in his 1986 paper. His objective was to create a regression formula by comparing the temperature record with tree rings for the modern record, then use it to provide temperature records from past tree rings. He detected an 18.6 and 22-year cycle. The problem is I also detected a 22 year cycle but in the precipitation pattern. This matched with evidence from other sources, especially other tree ring records.
Guiot’s attempt to create a regression formula against the modern instrumental record has promise for the right variables. The Hockey Stick people did it differently they tacked the modern temperature record on to the tree ring record. In his great book, The Hockey Stick Illusion A.W. Montford says, “The inclusion of the instrumental record was instantly controversial, with global warming skeptics accusing Mann of having spliced two entirely different data sets.’ Mann said they were not spliced but overlaid. The leaked email from Phil Jones to Ray Bradley on 16 November 1999 to Ray Bradley, revealed the overlay was the now infamous “hide the decline” or “Mike’s trick”. Tree ring data showed decline in the 20th century so the addition from Jones’ temperature record solved the problem. It was visually effective providing the sharp up turn of the hockey stick blade. Leaked emails were sensational but more telling were the leaked computer codes. They show how the computer was programmed to amend any undesirable trend.
Billions were wasted on climate research to prove the AGW hypothesis, including those used to create the hockey stick. Understandably politicians angered by misuse of funding to create deceptive science are canceling the grants. Researchers will be loathe to pursue similar valuable research and unlikely to get funding. It is minor collateral damage compared to the energy policies built around the false science, but damage to progress in understanding climate nonetheless.
Dennis Avery Tuesday, July 19, 2011M CFP
Get ready for the next big bombshell in the man-made warming debate. The world’s most sophisticated particle study laboratory - CERN in Geneva - will soon announce that more cosmic rays do, indeed, create more clouds in earth’s atmosphere. More cosmic rays mean a cooler planet. Thus, the solar source of the earth’s long, moderate 1,500-year climate cycle will finally be explained.
Cosmic rays and solar winds are interesting phenomena - but they are vastly more relevant when an undocumented theory is threatening to quadruple society’s energy costs. The IPCC wants $10 gasoline, and “soaring” electric bills to reduce earth’s temperatures by an amount too tiny to measure with most thermometers.
In 2007, when Fred Singer and I published Unstoppable Global Warming Every 1,500 Years, we weren’t terribly concerned with cosmic rays. We knew the natural, moderate warming/cooling cycle was real, from the evidence in ice cores, seabed sediments, fossil pollen and cave stalagmites. The cycle was the big factor that belied the man-made warming hysteria of the Intergovernmental Panel on Climate Change.
When Willi Dansgaard and Hans Oeschger discovered the 1,500 year cycle in the Greenland ice cores in 1984, they knew immediately that it was solar-powered. They’d seen exactly the same cycle in the carbon 14 molecules in trees, and in the beryllium 10 molecules in ice cores. Both sets of molecules are formed when cosmic rays strike our atmosphere. The cycle had produced a whole series of dramatic, abrupt Medieval-Warming-to-Little-Ice-Age climate changes.
The IPCC, for its part, announced that the sun could not be the forcing factor in any major climate change because the solar irradiation was too small. IPCC did not, however, add up the other solar variations that could amplify the solar irradiation. Nor had the IPCC programmed its famed computer models with the knowledge of the Medieval Warming (950–1200 AD), the Roman Warming (200 BC–600 AD), or the big Holocene Warmings centered on 6,000 and 8,000 BC.
The IPCC apparently wanted to dismiss the sun as a climate factor - to leave room for a CO2 factor that has only a 22 percent correlation with our past thermometer record. Correlation is not causation - but the lack of CO2 correlation is deadly to the IPCC theory.
Henrik Svensmark of the Danish Space Research Institute added the next chapter in the climate cycle story, just before our book was published. His cloud chamber experiment showed natural cosmic rays quickly created vast numbers of tiny “cloud seeds” when our mix of atmospheric gases was bombarded with ultra-violet light. Since clouds often cover 30 percent of the earth’s surface, a moderate change in cloud cover clearly could explain the warming/cooling cycle.
Svensmark noted the gigantic “solar wind” that expands when the sun is active - and thus blocks many of the cosmic rays that would otherwise hit the earth’s atmosphere. When the sun weakens, the solar wind shrinks. Recently, the U.S. Solar Observatory reported a very long period of “quiet sun” and predicted 30 years of cooling.
Last year, Denmark’s University of Aarhus did another experiment with a particle accelerator that fully confirmed the Svensmark hypothesis: cosmic rays help to make more clouds and thus could cool the earth.
The CERN experiment is supposed to be the big test of the Svensmark theory. It’s a tipoff, then, that CERN’s boss, Rolf-Dieter Heuer, has just told the German magazine Die Welt that he has forbidden his researchers to “interpret” the forthcoming test results. In other words, the CERN report will be a stark “just the facts” listing of the findings. Those findings must support Svensmark, or Heuer would never have issued such a stifling order on a major experiment.
Stay tuned.